- Discussions/
- #265/
Protocol-Owned HDX Liquidity on Kraken - 3-Month Review & Continuation Discussion
Referendum #335 · "HDX Liquidity Provision on Kraken" · Review period 2026-05-22 → 2026-08-11
TL;DR
- Spread: HDX/USD went from ~1-2% (often far worse) to a 1-3 bps median - CoinGecko shows 0.012% today
- Uptime & depth: two-sided quotes live 99.7% of hours - 100% over the last 28 days - and ±2% depth roughly doubled to ~$13k
- Counterfactual: without the operation's orders, filling a $1,000 order would cost ~10× more today
- Inventory: fully intact and grown - worth ≈ +$5k vs. simply holding; roughly half of that is repeatable LP margin, the rest directional gain from HDX's +78% recovery
- Resilience: crash dumps were largely absorbed (only ≈ $1.3k slipped through the wicks, ever); two attempts to exploit the operation's behavior failed; every incident led to a concrete improvement (289 commits since launch); no funds lost
- Cost: 3,600 HOLLAR operator fee → net ≈ break-even for the treasury this quarter
- Decision needed by ~Aug 21: continue (as-is / upgraded / rescaled) or wind down - the operator recommends continue, upscaled (6 months, +20k HOLLAR)
Three months ago the community approved Referendum #335 with 98.2% support: a controlled test lending treasury inventory to an automated liquidity operation on Kraken - HDX's only CEX listing. The test window closes around August 21, so it's time to review the results and decide together what happens next. This post is both the data report and the discussion starter: the good numbers and the uncomfortable ones, side by side.
1. What Referendum #335 authorized
| Item | Amount | Nature |
|---|---|---|
| HDX inventory | 8,000,000 HDX | Treasury-owned working inventory (returnable) |
| Stable inventory | 19,500 HOLLAR + 19,500 USDC | Treasury-owned working inventory (returnable) |
| Operator fee | 3,600 HOLLAR (1,200/month × 3, paid upfront at enactment) | Expense |
On-chain timeline (all UTC, independently verifiable): submitted 2026-05-14 · decision started 2026-05-15 · confirmed 2026-05-21 13:02 (tally: 1.182B aye / 22.3M nay, 8.1% support) · enacted 2026-05-21 13:15 in block 12,466,458 as a single treasury batch transferring the three inventory positions to the operations account and the operator fee. The operation was live within eleven hours - first on-chain activity 2026-05-21 23:53, first Kraken fills the morning of 2026-05-22. No inventory has been returned to the treasury yet - that is precisely what this review is to decide.
The stated goals: tighter spreads and deeper visible order-book depth on Kraken's HDX/USD and HDX/EUR markets, better market optics on aggregators like CoinGecko/CoinMarketCap and a healthier baseline for future listings - with review after 3 months against defined criteria: volume, average spread, order-book depth, liquidity within the ±2% band, inventory changes and operational issues. This report addresses exactly those criteria.
2. Data & methodology
All figures below come from sources that can be independently re-derived:
- A dedicated read-only data collector, separate from the trading system, recording since 2026-05-21: hourly Kraken L2 order-book snapshots (spread, depth bands, own-order share), all public trades on both pairs, all private fills/fees and hourly account-balance snapshots.
- Kraken public market data (OHLC history, ticker) for the pre-program baseline.
- Hydration on-chain data (indexed full-history warehouse) for treasury funding and the on-chain legs of the operation - every asset ledger reconciles exactly.
- CoinGecko for market-wide context.
"Program period" below means 2026-05-22 → 2026-08-11 (81 days).
3. Results vs. the review criteria
3.1 Spread ✅
Median top-of-book spread on HDX/USD went from triple-digit basis points to consistently 1-3 bps (≈ one tick):
| Month | HDX/USD median spread | HDX/USD avg spread | HDX/EUR avg spread |
|---|---|---|---|
| Launch week (pre/early bot) | ~100 bps | ~200 bps | ~486 bps |
| June 2026 | 2.9 bps | 15.4 bps | 221 bps |
| July 2026 | 2.1 bps | 14.7 bps | 165 bps |
| Aug 2026 (to the 11th) | 1.3 bps | 2.1 bps | 122 bps |
(hourly snapshots; averages are inflated by short spread-outs during the July volatility spike)
As of writing, CoinGecko displays Kraken HDX/USD with a 0.012% spread - major-asset territory and a world away from the multi-percent spreads referenced in the proposal. HDX/EUR improved ~4× but remains around 1% - it runs on a small fraction of the inventory (more on that below).
3.2 Order-book depth within ±2% ✅ (with context)
Average combined bid+ask depth within ±2% of mid and the share of it that was the operation's own liquidity:
| Month | HDX/USD ±2% depth | own share | HDX/EUR ±2% depth | own share |
|---|---|---|---|---|
| May (from launch) | $8.5k | 66% | €768 | 45% |
| June | $5.4k | 77% | €131 | 75% |
| July | $13.7k | 79% | €325 | 57% |
| August | $13.3k | 88% | €347 | 25% |
Two honest notes: the June dip is largely a price effect (HDX bottomed near $0.0035, shrinking the USD value of HDX-side depth) and depth is measured in a book where the operation is by far the dominant maker. An encouraging counterpoint: on HDX/EUR, third-party liquidity has recently been crowding in - total EUR depth grew in August while the operation's share fell to ~25%.
Measurement note: these figures come from our own hourly L2 snapshots, with the ±2% band anchored to Kraken's live mid-price at each snapshot. They will not always match the ±2% depth shown on CoinGecko/CoinMarketCap, which anchor the band to their own aggregated reference price - when Kraken temporarily drifts from that aggregate, their displayed window shifts off-center and can understate one side of the local book.
3.3 Liquidity uptime ✅ - including what happened in the crashes
Since go-live, two-sided quotes were present in:
- HDX/USD: 99.7% of hourly snapshots (1,942 / 1,948 - i.e. ≈ 6 hours of degraded quoting in 81 days, ~2 h/month)
- HDX/EUR: 99.2% of hourly snapshots (1,932 / 1,947 - ≈ 15 hours in 81 days)
(Hourly point samples, so these are estimates: the missed samples cluster on launch day, the crash days discussed below and a few Kraken-side outages/maintenance windows - they are not random failures of the operation and part of the downtime was outside its control entirely.)
The gaps correspond to brief restarts - and to the period's violent intraday sell-offs, which deserve their own honest treatment. The chart shows several dramatic wicks: May 31 (-59% intraday), June 1 (-12%), July 3 (-43%), July 7 (-26%), July 14 (-19%). During the sharpest legs of those flushes, quoting was briefly degraded - hourly snapshots caught momentarily blown-out spreads and, on three days, an hour or two of one-sided quoting while protective logic re-anchored.
Measured, however, the real impact was very small. On those five flush days:
| Day | Wick | Taker-sell flow | Bought by the operation | Slipped below its bids |
|---|---|---|---|---|
| May 31 | -59% | $10.6k | $8.3k (76% of sell flow) | $669 |
| June 1 | -12% | $0.8k | $1.2k (>100%: incl. recovery flow) | $0 |
| July 3 | -43% | $8.6k | $7.3k (82%) | $592 |
| July 7 | -26% | $19.1k | $17.9k (93%) | $28 |
| July 14 | -19% | $5.0k | $7.7k (>100%) | $9 |
The operation bought the dumps - 76-93% of all taker-sell volume on those days (on two of them more than the dump itself, absorbing the rebound flow too). What actually traded in the deep wicks was ≈ $1,300 in total across all five events: the wicks were nearly volume-less, produced by a few hundred dollars of market-sells punching through a thin residual book in seconds. No treasury loss resulted.
Each of these events was analyzed in depth to establish exactly what led to it and the findings were folded into the quoting and safety logic. Fully absorbing moves like these is ultimately a function of inventory size - an order book can only stand as deep as the capital behind it - but avoiding them carries high priority: a cleaner chart makes the liquidity provision visibly more credible.
Two further data points:
- Every incident translated into concrete improvements and the trend shows it: the single worst calendar-day drop of the entire window - August 3, -9.9% - was absorbed with a maximum hourly spread of 4 bps and uninterrupted two-sided quoting. What briefly dented quoting in early June barely registered by August.
- Deliberate attempts to take advantage of the operation's behavior have also occurred - and failed. See §3.6.
The most recent 28 days (Jul 15 → Aug 11) - the operation as it runs today:
| HDX/USD | HDX/EUR | |
|---|---|---|
| Two-sided presence | 100% (666/666 hourly samples) | 100% (665/665) |
| Median spread | 1.7 bps | 131 bps |
| ±2% depth (avg) | $17.1k | €395 |
| Quote volume | $264.6k | €25.0k |
| Worst day | Aug 3, -9.9%, absorbed at ≤ 4 bps hourly spread | - |
Not a single missed two-sided sample on either pair since July 14 - the flash-crash degradation discussed above simply stopped recurring. (The 28-day depth average is flattered somewhat by third-party liquidity that arrived during the late-July rally; the operation's own share of it was ~57%.) For completeness: the back-office rebalancing pipeline did still produce a handful of funds-safe incidents in this window, including a ~45-second process restart on Aug 1 - none of them visible in quoting (§3.6).
3.4 Volume ⚠️ honest reading required
Monthly quote-denominated volume on Kraken (from Kraken's own daily candles):
| Month | HDX/USD | HDX/EUR | Note |
|---|---|---|---|
| 2026-01 | $41.3k | €12.8k | pre-program |
| 2026-02 | $19.7k | €6.6k | pre-program |
| 2026-03 | $12.8k | €7.3k | pre-program |
| 2026-04 | $36.7k | €1.8k | pre-program |
| 2026-05 | $66.8k | €9.4k | program from May 22 |
| 2026-06 | $76.9k | €10.0k | |
| 2026-07 | $294.3k | €29.8k | HDX rally month |
| 2026-08 (11 days) | $30.9k | €4.0k | ≈ $84k/month run-rate |
Volume is up roughly 2-3× versus the Jan-Apr baseline at steady state, with July being an outlier driven by HDX's price surge.
The caveat this report will not hide: a large share of printed volume had the operation itself on one side - 56% of HDX/USD quote volume in May, rising to 90%+ in July/August (HDX/EUR: ~40-45%). Every such fill had a genuine third-party counterparty (self-matching is not possible), so this is real liquidity being consumed by real traders - but "Kraken HDX volume" should not be read as purely organic third-party-to-third-party flow. Over the period the operation executed 3,417 fills (~42/day), roughly balanced between passive (maker) and active (taker) executions.
Exact turnover and fees, program period (2026-05-22 → 2026-08-11):
| HDX/USD | HDX/EUR | |
|---|---|---|
| Market quote turnover (all prints) | $428,451 (81.36M HDX, 3,507 prints) | €49,785 (11.27M HDX, 704 prints) |
| Operation turnover | $364,995 (66.95M HDX, 3,000 fills) - 85.2% | €21,103 (4.73M HDX, 417 fills) - 42.4% |
| - of which bought | 65,853,483 HDX for $358,113.49 | 3,772,516 HDX for €16,591.12 |
| - of which sold | 1,092,679 HDX for $6,881.85 | 956,119 HDX for €4,511.49 |
| Kraken trading fees paid | $728.28 | €30.01 |
Total Kraken fees: ≈ $763 (at ~1.16 EUR/USD).
On-chain legs (2026-05-21 → 2026-08-11, from public chain data - all ledgers reconcile exactly):
| Amount | |
|---|---|
| HDX sold into Hydration on-chain liquidity | 67,446,352 HDX → 369,980.5 HOLLAR (4,177 trades) |
| HDX bought back on-chain | 580,858 HDX for 3,214.7 HOLLAR (58 trades) |
| Net on-chain hedge flow | 66,865,494 HDX sold for a net 366,765.9 HOLLAR |
| Stable conversions | 389,533.1 HOLLAR → 388,660.6 USDC and 18,848.1 USDC → 18,906.0 HOLLAR |
| Cross-venue inventory transfers | 71,916,672 HDX Kraken→chain (245 tx) · 9,060,285 HDX chain→Kraken (15 tx) · 408,160.6 USDC toward venues (354 XCM transfers) |
| Hydration network & protocol fees | ≈ 3,574 HDX (≈ $20-30), of which 1,824.75 HDX flowed back to the treasury via protocol fee splits |
| Stable-conversion cost (pool fees + peg drift, already in P&L) | ≈ $815 net on ≈ $408k of conversions (~0.20%) |
The on-chain side mirrors the Kraken side almost exactly (net ≈ 66.9M HDX sold on-chain vs. ≈ 67.6M net-acquired on Kraken): the operation continuously recycled inventory between the venues - roughly $389k of gross Kraken turnover against ~$39k of stable working capital (≈ 10× capital turnover). Omnipool swap fees are embedded in the realized execution prices and therefore already inside the P&L figures below.
3.5 Inventory changes & P&L ⚠️ the most important honest section
Inventory position, start vs. now:
| Start (2026-05-21) | Now (2026-08-11) | Δ | |
|---|---|---|---|
| HDX (all venues)* | 8,000,000 | 8,707,275 | +707,275 |
| Stables (USD/EUR/on-chain, USD-equiv) | $39,000 | ≈ $38,400 | -$600 |
* now-figure includes ~86k HDX reserved in in-flight on-chain orders; the operation's own conservative live accounting excludes those and shows +$4.7k instead of +$5.4k below.
Valuation (at each date's prices):
| Value | |
|---|---|
| Initial inventory at launch prices (HDX ≈ $0.0047) | ≈ $77k |
| Same inventory today if simply held ("HODL benchmark") | ≈ $106.5k |
| Actual inventory today | ≈ $111.9k |
| Outperformance vs. HODL | ≈ +$5.4k (+5.1%) |
So the operation ends the test period with the full inventory intact plus roughly $5k of added value, after all trading fees and transfer costs.
What that ≈ +$5k actually is: not all of it is market-making profit. The operation's hedging of Kraken fills against on-chain liquidity was at times delayed or manually assisted, which means the book carried some unhedged HDX exposure during a period in which HDX rose ~78%. Part of the outperformance is therefore directional - it depends on which way the market moved, not on repeatable LP margin. The decomposition below suggests the split was roughly even. The honest flip side: in a falling market the directional part would have weighed against the result instead of for it.
A rough decomposition (approximate by nature - fills and their hedges do not align neatly in time):
| Component | Rough estimate |
|---|---|
| LP/recycling margin - realized buy-on-Kraken → sell-on-chain loop, net of all fees and conversion costs | ≈ +$2k to +$3k |
| Directional component - hedge lag during the rally + the retained HDX surplus marked at today's price | ≈ +$2.5k to +$3.5k |
| Total vs. HODL | ≈ +$5.4k |
Method: the realized loop margin averaged ≈ 1.3% on ≈ 67M HDX cycled (≈ $4.7k gross, ≈ $3.1k after ≈ $1.6k of explicit costs), but instantaneous cross-venue spreads were typically nearer ~1%, so a slice of that realized margin is itself price drift from delayed hedging and belongs in the directional bucket - hence the ranges. The directional component flips sign in a falling market; the LP margin does not. Treasury should size its expectations accordingly.
Worth stating clearly: the accrued surplus is not withdrawn or distributed anywhere - it stays inside the working inventory as an operating buffer. It absorbs shortfalls (fees, conversion costs, temporary imbalances) that would otherwise force the operation to quote more defensively, so the buffer directly translates into more reliable liquidity.
3.6 Operational issues ⚠️ disclosed
- No loss of funds at any point. Cross-venue transfers are structured so that funds in a stuck transfer always sit parked at a known safe location.
- On at least two occasions, market participants attempted to take advantage of the operation's publicly observable quoting behavior. Both attempts failed and were unprofitable for the initiators; the operation surrendered no discounted inventory. Each attempt was analyzed afterwards and fed into the safety logic. No further details are shared here - there is no need to publish a playbook.
- The cross-venue rebalancing pipeline was the main source of friction: over the period there were multiple incidents (stuck transfer steps, withdrawal-detection gaps, a pricing-check bug, transaction-nonce races) that paused individual rebalance lanes, several of which required manual intervention to complete. Every incident produced a concrete fix - automated detection and recovery improved substantially over the period, though occasional manual assistance is still needed as of today.
- This was active engineering, not a set-and-forget deployment: since launch the operation received 289 commits - 207 to the trading system itself (80 in May, 51 in June, 66 in July, 10 in August so far) and 82 to its supporting trading library. The declining incident rate (§3.3) is the result.
- Ecosystem side-benefit: operating at this intensity also surfaced an issue in the official Hydration SDK. It was reported upstream and is scheduled to be fixed for all ecosystem users in the SDK's next major release - a small dividend of the program beyond the order book.
- Quoting itself (the user-visible side) was largely unaffected - see the 99%+ uptime above.
- The data behind this report is collected by an independent read-only system, outside the trading stack, precisely so this review would not depend on the operator's own bookkeeping.
3.7 What would the book look like without the operation?
Reconstructing every hourly snapshot with the operation's orders removed gives a direct estimate of the counterfactual. Top-of-book can look deceptively tight without it (small third-party orders shadow the operation's quotes), so the honest measure is the cost of actually executing size - median round-trip cost (buy + sell back) in August:
| Order size | With the operation | Without it |
|---|---|---|
| $100 | ~0.01% | ~3.4% |
| $500 | ~1.1% | ~7.1% |
| $1,000 | ~1.7% | ~10.7% |
In May-June the picture was starker still: without the operation's orders, a $500-$1,000 execution frequently could not be filled within the visible book at any price. Note the "without" columns are still optimistic - most of the residual book only quotes because it shadows the operation. This is not just reconstruction, either: during one brief controlled restart of the operation, the live book was observed with a spread of ~85% until quoting resumed. Both observations are consistent with the multi-percent spreads the proposal described from the pre-LP era and with what HDX's only CEX listing likely reverts to if the program stops.
(Also honest: the headline 1-tick spread applies to small orders - with the operation, larger executions pay ~1-2% round-trip as depth is distributed across the band. That is normal for an asset of this size.)
4. Cost/benefit for the treasury
| Item | Amount |
|---|---|
| Operator fee (paid upfront for 3 months) | -3,600 HOLLAR (≈ -$3.6k) |
| Kraken trading fees (paid from inventory, already in P&L) | -$728.28 and -€30.01 (≈ -$763) |
| Hydration transaction fees (already in P&L) | -1,743.9 HDX, plus -5.1 HDX in priority tips (5 of 3,250 txs) |
| DCA execution fees (already in P&L) | -1,824.75 HDX - paid straight back to the Hydration treasury |
| Omnipool trading fees (embedded in execution prices, already in P&L) | -1,005.9 HOLLAR, -162.3 H2O, -1,466.4 HDX (≈ -$1.7k to -$2.0k) |
| Stable-conversion cost incl. its pool fees (already in P&L) | ≈ -$815 |
| Inventory value added vs. HODL, net of all the above trading costs | ≈ +$4.7k to +$5.4k |
| Net treasury economics vs. simply holding | ≈ +$1.1k to +$1.8k - approximately break-even |
(All rows marked "already in P&L" are informational - they are contained in the inventory value above, so the bottom line is simply value added minus the operator fee. A slice of the on-chain fees - the DCA fees and part of the omnipool fees - flows back to the Hydration protocol and treasury rather than leaving the ecosystem.)
In other words: this quarter the treasury got major-league spreads, ~doubled visible depth, 99%+ liquidity uptime on its only CEX listing and materially better market optics - at approximately no net cost. Two grains of salt belong next to that sentence: the favorable market that balanced the books was itself partly supported by the treasury's own buyback activity and the honest long-term expectation is that the treasury pays for this service through risk rather than earning from it - some quarters will show a negative inventory P&L.
5. Market context during the test
- HDX had fallen from ~$0.0134 (Nov 2024) to ~$0.0020 (Mar 2026); the program launched near the lows at ~$0.0047 and HDX now trades near $0.0084 (+78% over the period; +65% in the last 30 days).
- Kraken remains HDX's only CEX listing; on quiet days it now shows the tightest HDX market anywhere including on-chain venues.
- HDX market cap ≈ $50M (rank ~#424, CoinGecko).
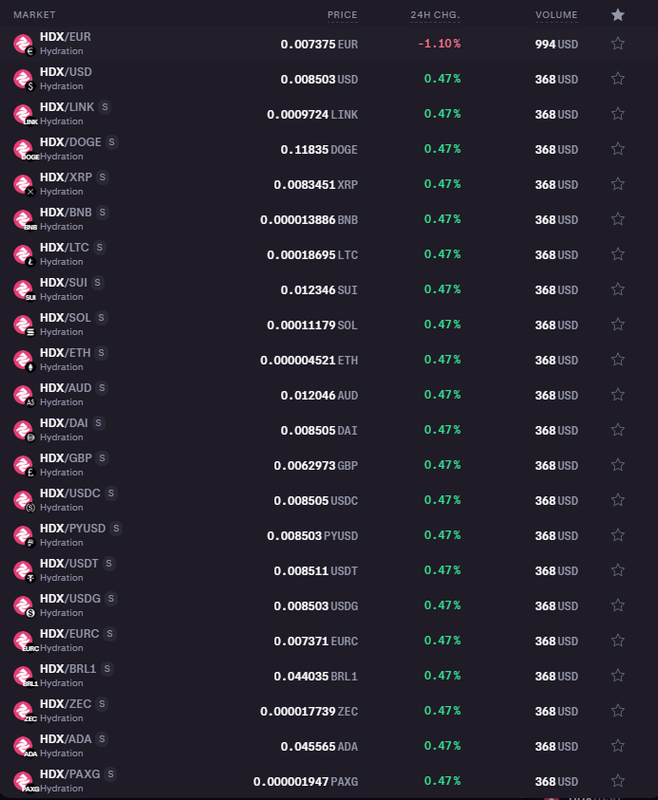
- Kraken recently enabled ~20 additional synthetic HDX trading pairs. Whether that was triggered by the improved base-market liquidity cannot be proven from the outside - but tight, liquid base markets are a prerequisite for such listings, not every asset is eligible and the LP program clearly contributes to meeting that bar.
6. Strengths, weaknesses and what a continuation should fix
What demonstrably worked
- Spread compression of ~two orders of magnitude on HDX/USD, sustained for months
- 99%+ two-sided uptime, fully automated quoting; crash dumps largely absorbed (§3.3)
- Two attempts to take advantage of the operation defeated at zero cost to the inventory (§3.6)
- Every incident converted into a concrete improvement (289 commits since launch) - June's stress didn't repeat in August
- Battle-testing dividend: an issue in the official Hydration SDK was uncovered and will be fixed for everyone in its next major release
- Inventory custody discipline: complete, independently collected and on-chain-reconciled data trail; inventory intact
- Early signs of third-party liquidity crowding in (HDX/EUR August)
What deserves scrutiny
- Volume optics: most printed volume involves the operation on one side
- Roughly half of the P&L came from directional exposure in a rising market; that component carries symmetric risk
- Brief quoting degradation during flash crashes (measured impact ≈ $1.3k of prints total - but the optics of chart wicks are real)
- HDX/EUR remains wide (~1%) on its small inventory slice
- Rebalancing still needs occasional manual intervention
- Single-operator, exchange-custody concentration (as acknowledged in ref #335's own risk section)
If continued, the operator proposes
- Governance-recallable inventory - inventory (plus accrued P&L) returnable to the treasury on referendum at any time, as now.
- A decision on HDX/EUR - either allocate enough inventory to quote it properly or accept it as a satellite market.
7. The decision in front of the community
The 3-month test window closes ~2026-08-21. The options, roughly:
| Option | What it means |
|---|---|
| A. Continue unchanged | Same inventory & fee, next review in 3 months |
| B. Continue, upgraded | Same inventory & fee, next report in 3 months, next review in 6 months; a decision on HDX/EUR |
| C. Rescale | Increase (deeper books, proper EUR) or decrease (return part of inventory) |
| D. Wind down | Return 8M HDX + stables + P&L to treasury; spreads likely revert toward pre-program levels (§3.7) |
As operator I'd recommend C. Rescale: continue with the upgrades from B (6 months, periodic public reporting, quarterly reviews) and top up the stable side by ~20k HOLLAR to restore the launch 50/50 inventory balance - the HDX rally has left the book 66/34, and bids can only be funded with stables. The top-up directly funds deeper bid-side absorption during sell-offs (fewer and shallower wicks), mechanically reduces the book's directional HDX weight and optionally enables a properly quoted HDX/EUR - all without selling a single HDX into the market.
Questions for the community:
- Is ~$13k of ±2% depth and a 1-tick spread on our only CEX listing worth 1,200 HOLLAR/month plus symmetric inventory risk?
- Should the mandate prioritize strict risk-neutrality (smaller but steadier P&L) or allow opportunistic inventory positioning?
- Is HDX/EUR worth a proper inventory allocation, or should it stay a satellite?
- Which KPI floors should be part of the mandate and how often do you want to see the numbers?
All raw data (hourly order-book snapshots, fills, balances, on-chain flows) exists in append-only form and can be shared for independent verification. Looking forward to the discussion - including the critical takes.
A personal note from the operator
Honesty cuts both ways, so one more thing. At times during these three months it was genuinely demotivating to watch the operation act primarily as exit liquidity for dumps on Kraken. Two thoughts kept it in perspective. First: those sellers would very likely have sold either way - just probably not on Kraken, where their size had no market before the added liquidity. The program turned selling that would have happened elsewhere into CEX volume and absorbed it at fair prices. Second: this is simply what the early phase of market building looks like. Tight quotes come first; organic two-sided flow follows. We are still far away from beautiful candles - LP alone does not create them, constant trading activity and volume do.
Which is exactly the idea behind standing liquidity: an always-there book is a permanent invitation to trade. So take this as an open invitation - if you trade HDX anyway, consider routing it through Kraken and take advantage of the tight spreads whenever it suits your trading. Every organic order moves this market a step closer to sustaining itself.
Appendix A - Data sources
| Source | Used for |
|---|---|
| Dedicated read-only Kraken collector (hourly, 2026-05-21 →) | Spread, depth bands, own-liquidity share, fills, fees, balances |
| Kraken public API (OHLC, ticker) | Monthly volumes incl. pre-program baseline, current spread |
| Hydration on-chain data (indexed full-history warehouse) | Treasury funding, on-chain legs, referendum timeline |
| CoinGecko | Market cap, rank, venue comparison |
The operations account is 121VfWrMN1DwrHu1Jc8UE7Cppp7YHcZxtnFDZnZCztpdeHDX. The funding batch is in block 12,466,458. All on-chain flows of the operation (funding in, hedge legs, cross-venue transfers, current balances) reconcile exactly against public chain data.
Appendix B - Monthly KPI table (HDX/USD)
| Month | Median spread (bps) | ±2% depth | Own depth share | Quote volume | Bot share of volume | Two-sided uptime |
|---|---|---|---|---|---|---|
| May (from 22nd) | ~3* | $8.5k | 66% | $66.8k† | 56% | 99%+ |
| June | 2.9 | $5.4k | 77% | $76.9k | 70% | 99.6% |
| July | 2.1 | $13.7k | 79% | $294.3k | 90% | 99.7% |
| Aug 1-11 | 1.3 | $13.3k | 88% | $30.9k | 97% | 100% |
* post-launch days only; the full-May average includes the pre-launch book. † full calendar month.
🦒
Reply
Up
Comments